Abstract
Traditional Cost of Quality Models (CoQ), established in the 1950s and refined in the 1970s, have served as valuable tools for identifying waste and cost-saving opportunities. However, their use in today’s pharmaceutical industry is limited, as they fail to resonate with today’s financial frameworks or drive strategic decision-making. This article introduces the Quality Value Index (QVI) and Financial Risk Number (FRN), innovative tools that reframe quality as a strategic contributor to financial performance. By categorizing quality activities into Revenue, Cost of Goods Sold (COGS), and Labor Impacting metrics, the QVI quantifies their business value, while the FRN prioritizes risk mitigation based on financial exposure. Through case studies and practical implementation steps, we demonstrate how quality organizations can shift from compliance-driven cost centers to value-driven business partners, enhancing competitiveness and operational efficiency.
Introduction
Cost of Quality Models (CoQ), pioneered by Juran in the 1950s and later refined by Juran and Gryna in the 1970s, quantify waste and highlight opportunities for cost optimization. Despite their historical significance, CoQ models have fallen out of favor due to their focus on cost reduction rather than value creation. The term “cost” suggests mini-mization, undervaluing quality’s role in revenue generation and risk mitigation. Many companies have not implemented an alternative to the CoQ models and do not have good quantitative financial measures for quality related activities, which makes it practically impossible to optimize operations financially.
This article presents the Quality Value Index (QVI), a framework that redefines quality activities as financial contributors, and the Financial Risk Number (FRN), a metric for prioritizing high-impact risk mitigation. Together, these tools enable quality organizations to align with corporate financial goals, demonstrating tangible contributions to business success.
Quality Value Index (QVI)
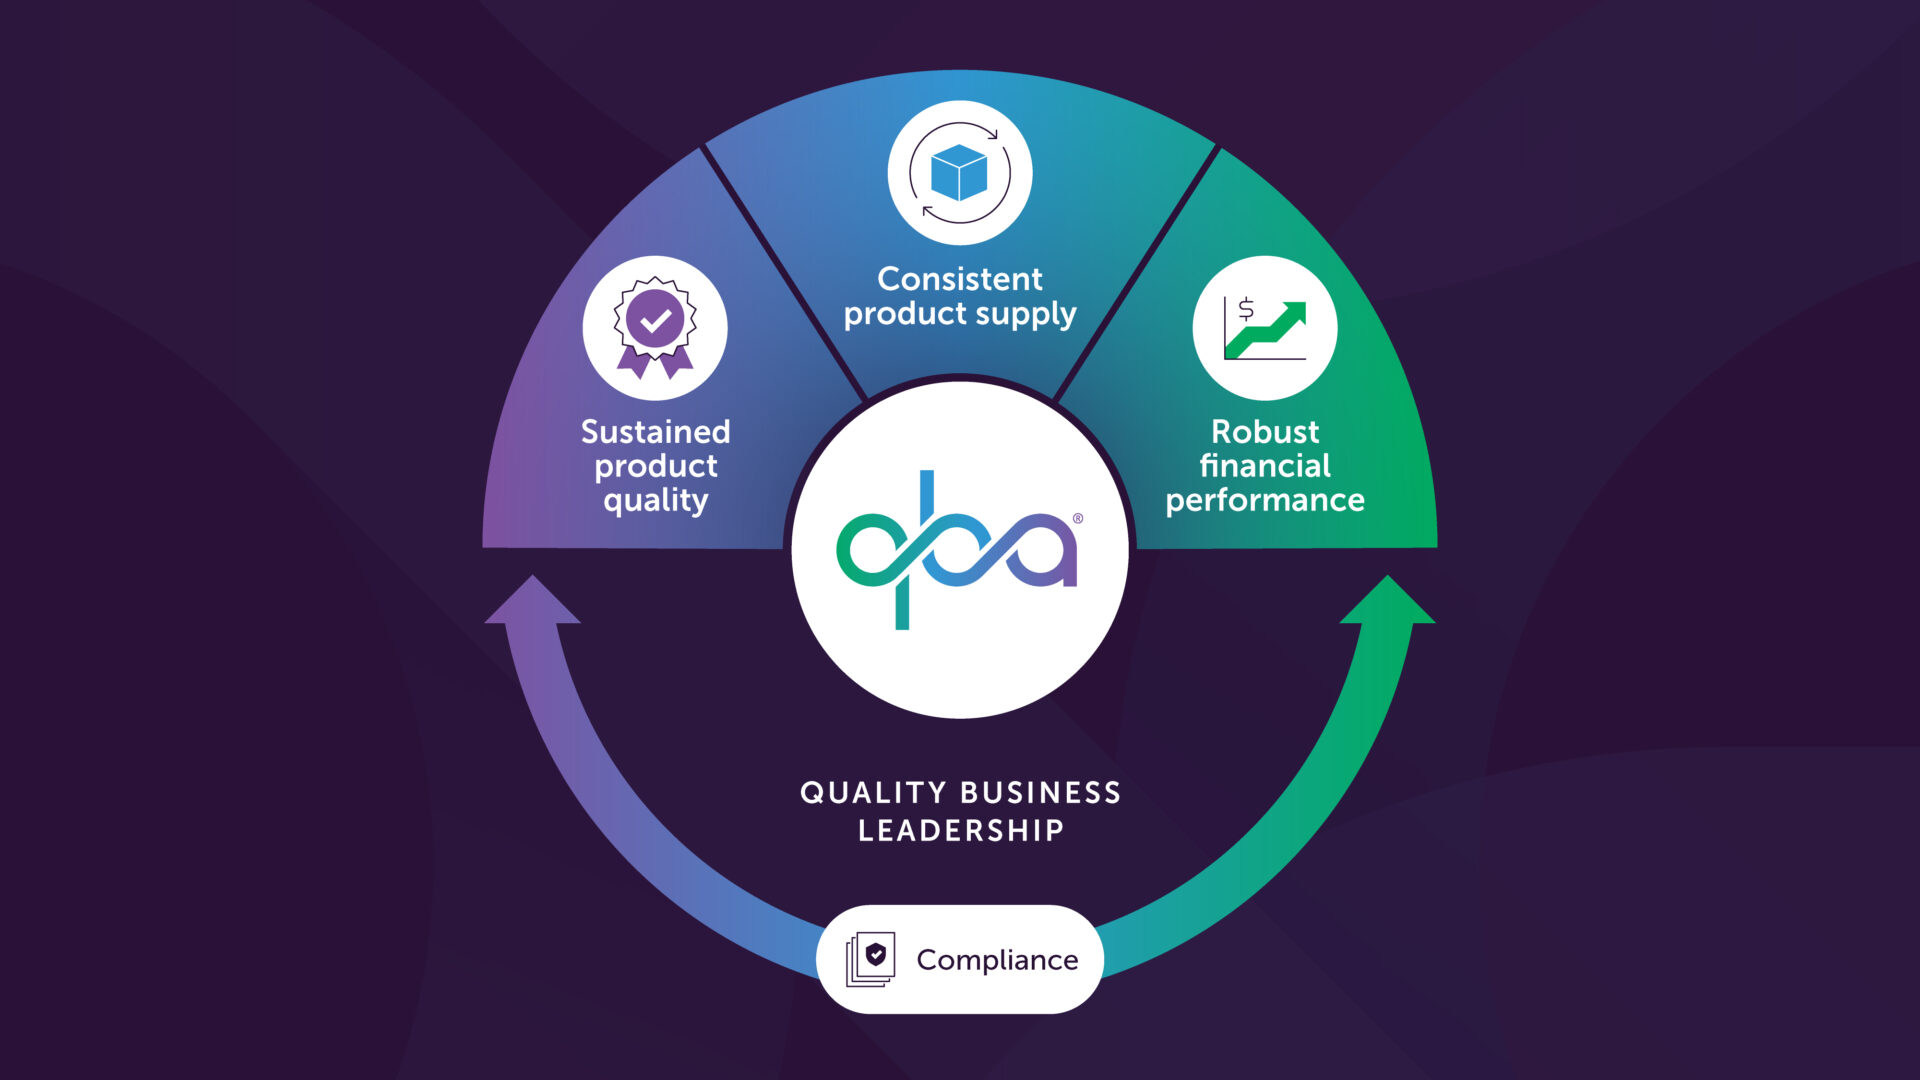
The term “cost” in cost of quality inherently implies reduction, which can unintentionally diminish the perceived value of quality-related activities. In contrast, the word “value” conveys optimization and strategic importance, something you aim to increase, not cut. Traditional CoQ models categorize cost into four categories: Prevention, Appraisal, Internal Failure and External Failure. These categories, however, do not align easily with corporate financial reporting. The Quality Value Index redefines these categories to reflect their direct impacts on revenue, cost of goods sold (GOGS), and labor costs, as illustrated in Figure 1.

Revenue Impacting
This category quantifies the financial impact of unavailable product for sale, such as batches lost due to quality issues. Reducing lost batches or mitigating revenue losses represents one of the most compelling ways for the quality organization to demonstrate its business value. Estimating this metric is challenging, as it assumes potential sales are forfeited when products fail to reach the market. However, in the context of drug shortages lost material directly translates to lost sales, making this a vital indicator of quality’s financial contribution.
Calculation Methodology
Establishing a baseline is essential for meaningful comparisons. One approach is to analyze historical data to quantify the annual revenue impact of lost products. To demonstrate improvements, leverage data from the Corrective and Preventive Action (CAPA) system to identify quality-driven initiatives and their outcomes. The CAPA system is a cornerstone of quality’s value-added activities, as it drives process enhancements and prevents recurrence of issues. But to fully maximize its impact, this data must be systematically analyzed and translated into financial terms, enabling clear communication of quality’s role in enhancing revenue.
Case Study: Quantifying Revenue Impact through Quality Improvements
In 2023, a mid-sized pharmaceutical company producing a high-demand injectable lost 25 of 500 batches produced (5%) due to quality issues, primarily contamination and packaging defects. These losses resulted in product unavailability, directly contributing to $5 million in lost revenue, with an estimated market value of $200,000 per batch. In the context of industry-wide drug shortages, each lost batch represented a confirmed lost sale.
In 2024, CAPA system analysis revealed that contamination stemmed from inconsistent cleaning validation processes, while packaging defects were linked to outdated equipment. The quality team implemented targeted improvements, including enhanced cleaning validation protocols supported by staff training and concise, visual standard operating procedures (SOPs). Additionally, upgraded packaging equipment was installed to mitigate defects.
These CAPA-driven interventions reduced batch losses from 25 to 10 in 2024, lowering the lost revenue from $5 million to $2 million. This reduction in lost batches preserved $3 million in potential sales ($200,000 per batch × 15 batches).
The quality leadership team presented these findings to senior management, incorporating the savings into a financial scorecard to highlight the quality organization’s contribution to business performance. This case exemplifies how the QVI Model translates quality improvements into measurable financial value, reinforcing the strategic role of quality in mitigating revenue losses.
Cost of Goods Impacting
Quality activities play a critical role in safeguarding product integrity, ensuring market availability, and mitigating financial risks. Activities like raw material and in-process testing minimize waste and rejected batches, directly reducing COGS. However, traditional metrics like batch release cycle time, investigations closed on time, total deviations, severity of deviations, average testing time or number of complaints often fail to convey financial value. By translating their outcomes into financial terms like revenue preservation, cost avoidance, or efficiency gains quality organizations can align better with business priorities like maximizing production or improving efficiency.
Calculation Methodology
To demonstrate the financial value of quality activities, quality organizations must present a compelling, data-driven case that aligns with the company’s strategic priorities. A critical first step is to identify the organization’s financial goals and objectives.
Some companies are more focused on maximizing revenue by getting as much product to market as fast as possible, particularly with high demand products or drug shortage situations. Others, in mature markets with ample supply may prioritize operational efficiency or cost reduction by minimizing COGS. Companies with newer processes may target reductions in rework, waste, or batch rejections to stabilize production. Tailoring quality initiatives to the organization’s objectives ensures quality is contributing directly to the success of the business.
Once a historical baseline is established, quality teams can quantify the financial impact of their initiatives. For example, CAPA-driven improvements often yield measurable benefits like:
- Enhanced raw material supplier audits and testing protocols that mitigate contamination risks preventing batch losses that previously cost millions in revenue.
- Real-time in-process testing improve-ments that detect deviations earlier, reducing labor hours and cost associated with reworked batches.
- Streamlined batch record review processes enabled by digital tools or machine learning that accelerate product release, increase inventory turnover and shorten time to market.
These initiatives, tracked within the QVI’s Revenue, COGS, and Labor Impacting categories, translate quality efforts into financial outcomes, such as preserved sales, reduced production costs, or improved efficiency.
Quality initiatives and process improvements are occurring within organizations, offering numerous opportunities to demonstrate value. Collaboration with finance and operational excellence teams can help identify high-impact activities and validate financial calculations. These partnerships also ensure credibility and align quality metrics with corporate financial reporting, enabling quality business leaders to communicate their contributions in business terms and gain executive support for further investments.
Labor Impacting
Quality organizations can strengthen their value by effectively managing labor costs, not just by reducing headcount, but by shifting effort from reactive, compliance-focused tasks to proactive initiatives that deliver financial benefits. By prioritizing prevention over corrective actions and streamlining quality systems organizations can reallocate labor to activities that improve efficiency, reduced waste, and ensure product availability.
To quantify labor costs, organizations should address both prevention (e.g., training, automation) and appraisal (e.g., testing, manual reviews) activities and establish a historical baseline, typically spanning several years. The Corrective and Preventive Action (CAPA) system can be a key starting point, as corrective actions like deviation investigations or CAPA implementation require significant labor due to their reactive nature.
For example, a company might dedicate 500 FTE hours per quarter to deviation investigations, costing $50,000 at $100 per hour. Preventive measures, such as improved training or real-time in-process monitoring, can reduce deviation rates and labor needs.

In one case, automated batch record reviews cut investigation hours from 500 ($50,000) to 200 ($20,000) per quarter, saving $30,000. Leadership reinvested these savings into other process improvement projects, further enhancing quality’s financial impact.
Streamlining compliance-heavy tasks, such as manual batch record reviews or redundant documentation, can also reduce labor costs. AI, digital tools, standardized templates, and integration with other business systems can reduce hours while still maintaining regulatory compliance. For instance, a digital quality management system (QMS) reduced batch record review time by 50%, saving 1,000 hours annually ($100,000). The company redirected these savings to more supplier audits, preventing $1 million in batch failures by improving raw material quality.
To communicate this value, quality business leaders should quantify labor savings and highlight reinvestment strategies using the QVI framework. One way would be to maintain a financial dashboard showing labor costs before and after improvement. Using the above examples, one could include $30,000 in labor savings from automation and $100,000 from a new QMS implementation.
Shifting labor from appraisal to prevention activities highlights that quality teams can make contributions to financial performance – not just regulatory compliance. Collaboration with finance to validate these figures also builds credibility and strengthens the case, positioning quality as a vital business partner.
Financial Risk Number (FRN)
Implementing the Quality Value Index (QVI) shifts the focus to activities that drive business value and position Quality as strategic business leader. Another key tool to support this transformation is incorporating financial impact into the risk register, enabling quality teams to prioritize actions that not only reduce risk to patients but also enhance financial performance and align with organizational goals.
Most companies now operate with a risk register. The risk register lists all known risks to patient safety, drug efficacy and quality in terms of severity (S), occurrence, or probability (O) and detectability (D).
Traditionally, risk registers prioritize mitigation activities using Primary Risk Numbers (PRN) by ranking risks based on their severity (S) and likelihood of occurrence (O) or by using Risk Priority Numbers (RPN) which add the additional factor of detectability (D). PRNs or RPNs that have the highest scores are mitigated first. This approach has been in use in many companies for several years to reduce risk to patients.
The Financial Risk Number introduces an additional angle to risk mitigation, the risk to business. This novel approach factors in the cost of correction (C), if the risk were to occur versus the cost of prevention (P), and is calculated as:
This approach highlights risks where correction costs far exceed prevention costs, making them high-priority targets for mitigation. Risks that have a high ratio of C/P i.e. where cost of correction is increasingly higher than the cost of prevention will rank highest in the risk register.
For example, consider two risks with identical severity, occurrence, and correction cost of $5 million. If one risk has a prevention cost of $1 million, the C/P ratio would be $5M/$1M or 5 resulting in an FRN = 5 × PRN.
The other risk has a prevention cost of $50,000 giving a C/P ratio of $5M/$50k or 100 resulting in an FRN = 100 × PRN. The latter would be prioritized for mitigation due to its financial risk number being 20 times higher than the first.

In one company, applying FRNs to a risk register identified a packaging defect risk with a $10 million correction cost (potential recall) and a $200,000 prevention cost (equipment upgrade), yielding a high FRN that justified immediate action, avoiding significant financial loss.
Case Study: Incorporating the Financial Risk Number (FRN) into Risk Management
The data presented in Figure 2 reflects a pharmaceutical company’s risk register, identifying ten patient-related risks. Each risk is evaluated based on severity (S), probability of occurrence (O), and likelihood of detection (D), with scores ranging from 2 (lowest) to 10 (highest). Using the Priority Risk Number (PRN = S × O), risks B and D emerge as the highest priorities, each with a score of 60. When detectability is factored in, the Risk Priority Number (RPN = S × O × D) identifies risk F as the top priority, with a score of 384.

However, the financial risk number (FRN) introduces the cost of correction (C) and cost of prevention (P) to the assessment, clearly revealing risk I as the most financially significant.
The C/P ratio for risk I is 156 a prevention cost of $45,000 compared to a correction cost of $7,000,000 with a medium likelihood of occurrence (O = 6).
Presenting the FRN to Senior management could help justify budgeting $45,000 for proactive risk mitigation instead of having to correct the risk with a potential $7,000,000 impact to the P&L.
Integrating Financial Risk Numbers (FRNs) into Risk Management
Incorporating Financial Risk Numbers (FRNs) into your risk register enables quality pro-fessionals to engage finance partners and executive leadership into the work of quality by framing quality risks into financial terms they are used to rather than relying solely on compliance-based language.
The adoption of FRNs fosters meaningful dialogue with senior leadership, facilitating proactive budget allocation for risk mitigation to prevent costly corrective actions that could impact profitability.
Patient safety should always remain the primary focus for prioritizing risk mitigation, although financial considerations should also guide sound decision-making. Companies should implement a structured, systematic approach to prioritize risk mitigation strategies, balancing patient safety with financial prudence.
Additional Risk Prioritization Calculations
To further refine risk prioritization, organ-izations may consider additional metrics such as the Cost of Avoidance (CofA = C – P) or the Weighted Cost of Avoidance (WCofA = O × (C – P)). These calculations enable a more informed level of decision making by highlighting risks with significant cost differentials and high likelihood of occurrence.
To implement FRNs effectively, organizations should update risk registers regularly, use approximate C and P estimates, recognizing the common tendency to underestimate correction costs, and incorporate FRN discussions in management reviews or dedicated risk meetings. Ensuring risk rankings do not overly emphasize detectability helps prioritize risks with high financial impact.
Transitioning to a Quality Business Leader
Quality professionals are very effective at reporting compliance metrics like deviation rates, CAPA timeliness, and batch release times. But these metrics often fail to convey financial value and thus makes it impossible to identify opportunities for improved financial performance for the company. The QVI and FRN shift this paradigm by providing tools to help quality leaders quantify impact of quality and compliance related activities on revenue, COGS, and labor as well as adding a business impacting dimension on identified risks. It is important to note that implementing this shift takes time. For an effective implementation:
Strategies for QVI Model Implementation
- Establish Baselines: Use historical data (e.g., batch losses, CAPA outcomes) to quantify financial impacts of poor quality.
- Collaborate with Finance: Validate calculations to ensure credibility and alignment with corporate metrics.
- Translate Metrics: Convert activities into financial outcomes (e.g., revenue preserved, costs reduced, risks avoided).
- Use Case Studies: Share CAPA-driven success stories, like the $3 million revenue preservation in the case study.
- Align with Goals: Link quality outcomes to leadership priorities (e.g., supply chain reliability, customer satisfaction).
- Create Scorecards: Develop visual dashboards tracking QVI categories (Revenue, COGS, Labor) using business terms like “revenue saved” or “cost avoided.”
- Simplify Processes: Streamline labor-intensive tasks to reallocate resources to high-value initiatives.
Strategies for FRN Implementation
- Introduce Financial Risk Numbers (FRNs) to the risk register to highlight financial implications or risks to the business. FRNs emphasize high cost-of-correction to cost-of-prevention (C/P) ratios, engaging finance, and executive management by framing quality risk management in financial language.
- Establish a structured, documented process for prioritizing risk mitigation, ensuring patient safety remains the highest priority while also focusing on risks to the business.
- Incorporate FRN discussions with Executive Leadership in management reviews or risk meetings to prioritize mitigation strategies, minimizing cost of corrections for materialized risks that impact the P&L.
- Consider using the Weighted Cost of Avoidance (WCofA = O × (C – P)) as an additional financial metric to prioritize risks with significant cost-of-correction to cost-of-prevention differentials and high likelihood of occurrence.
- Regularly update risk registers and adjust risk mitigation priorities to reflect current data and evolving risk assessments.
Conclusion
The Quality Value Index and Financial Risk Number redefine quality as a strategic asset in the pharmaceutical industry, moving beyond the outdated CoQ paradigm. By quantifying financial contributions through Revenue, COGS, and Labor Impacting categories, the QVI aligns quality with the organizational business objectives, while the FRN add a business dimension to prioritize risk mitigation to protect financial performance. Implementing these tools requires understanding the org-anization’s goals, collaborating with finance, establishing data-driven baselines, and shifting from compliance to business-focused language. Quality business leaders who adopt this approach foster greater executive support by demonstrating their commitment to patient safety and their role as a value-driven partner aligned in achieving organizational success.
This article draws insights from the “Certificate in Quality Business Leadership” program accredited by the Technological University of Dublin, an advanced certification program to develop leadership traits for Quality Business Leaders. Anders Vinther, founder of Quality Business Administration, LLC has over three decades of expertise as a quality executive in the pharmaceutical industry. Craig Elliott, former Chief Financial Officer of the Parenteral Drug Association, microbiologist, and chemist has held various roles within quality.